machine monitoring
The dashboard provides real-time visibility into all your machines' health, performance, and process status.
machine status
online/offline detection
The agent sends a heartbeat to Firestore at an adaptive interval - every 5 seconds when the system tray is open, 30 seconds when processes are running, or 120 seconds when idle.
The machine card status pill is binary:
| status | condition | indicator |
|---|---|---|
| online | Agent reports the machine as online | Green pill |
| offline | Agent reports offline, or the dashboard's local timeout fallback marks an old heartbeat offline | Red pill |
The adjacent heartbeat timestamp uses a separate stale-display rule. Heartbeats newer than 5 minutes render as a clock time in the selected dashboard timezone. Heartbeats older than 5 minutes render as a relative age, such as 14m ago, in red.
last seen
Each machine shows a last-heartbeat timestamp. For offline or stale machines, this tells you when the machine last communicated. The timestamp tooltip always shows the full date, time, and timezone.
system metrics
Metrics are reported by the agent alongside each heartbeat (see adaptive interval above):
| metric area | values shown |
|---|---|
| CPU | Per-CPU usage percentage, model, and temperature when reported |
| memory | RAM usage percentage plus used/derived total GB |
| disk/storage | Per-volume storage percentage, used/total GB, and read/write disk I/O throughput |
| GPU | Per-GPU usage percentage, VRAM usage, and temperature when reported |
| network | Per-NIC transmit/receive throughput and utilization, plus gateway ping latency and packet-loss percentage when available |
| displays | Live monitor topology, monitor count, effective resolution after rotation, primary-display marker, mosaic data, display-drift indicator, and auto-restore circuit-breaker indicator |
| local time | Machine local clock and IANA timezone when multiple machine timezones are visible |
| screen access | Machine-menu entry points for screenshot capture/history and live view on online machines |
color coding
Usage metrics use the same threshold bands as the dashboard accent bars and hover rings:
| color | threshold | meaning |
|---|---|---|
| Emerald | 0-29% | Low usage |
| Violet | 30-49% | Medium-low usage |
| Sky | 50-69% | Medium usage |
| Amber | 70-84% | High usage |
| Red | 85-100% | Critical usage |
Temperature values use separate hardware thresholds: normal below 70 C, warning from 70 C to below 85 C, and critical at 85 C or higher. Temperatures can display in Celsius or Fahrenheit according to the user's preferences.
view modes
card view
The default view displays each machine as a card:
- Machine name and status indicator
- Last-heartbeat timestamp and optional local machine clock/timezone
- CPU, memory, disk/storage, GPU, and network metrics
- Disk read/write throughput and network transmit/receive throughput
- Display topology summary with drift and auto-restore indicators
- Sparkline mini-charts showing recent trends
- Process list with status badges
- Agent version
- Machine menu actions for screenshot capture, live view, reboot/shutdown, alert muting, token revocation, and machine removal when permissions allow
Click a machine card to expand details.
list view
A compact table view with sortable columns:
- Machine name
- Status (online/offline)
- CPU, memory, disk/storage, GPU, and network values
- Display entry point with drift and auto-restore indicators
- Process count
- Last heartbeat
- Agent version
Useful when managing many machines.
sparkline charts
Each metric in card view shows a tiny sparkline chart representing recent values. These give you an at-a-glance trend without clicking into the machine.
historical metrics
Click on a machine to view detailed historical metrics:
time ranges
| range |
|---|
| hour |
| day |
| week |
| month |
| year |
| all |
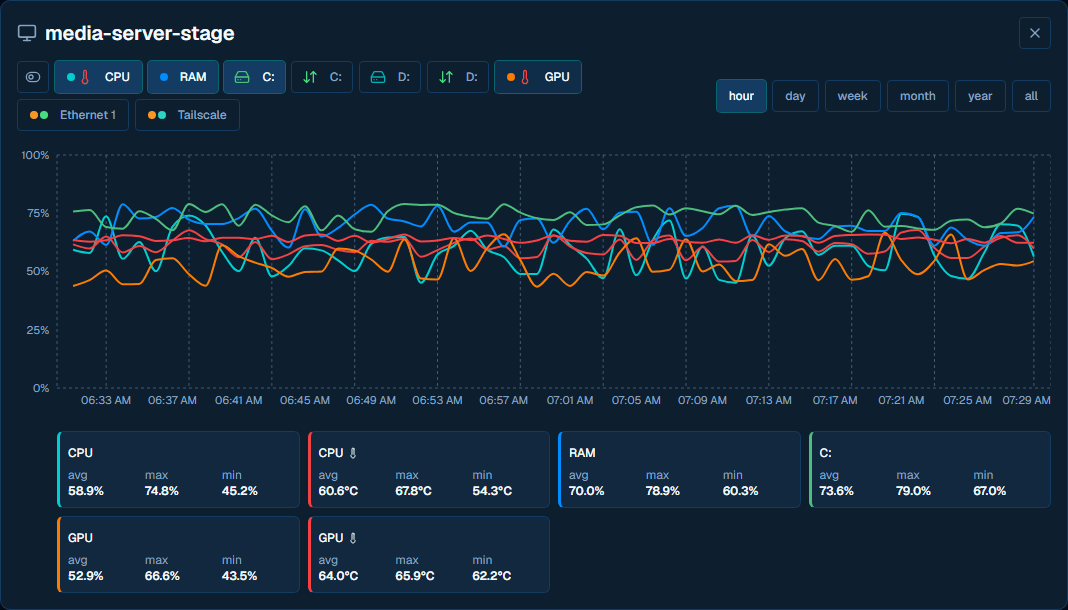
charts
The metrics detail panel shows interactive Recharts line graphs for:
- CPU usage and temperature over time
- Memory usage over time
- Per-disk storage usage over time
- Per-volume disk I/O read/write activity
- GPU usage, VRAM usage, and temperature over time (if available)
- Per-NIC network transmit/receive utilization or throughput
- Display topology detail through the display panel
Hover over data points for exact values and timestamps.
process status
Each machine card shows its configured processes with status badges:
| badge | state | meaning |
|---|---|---|
| Green | RUNNING | Process is alive and responding |
| Yellow | STALLED | Process exists but not responding |
| Red | KILLED | Process was terminated |
| Red | STOPPED | Process not running because launch mode is off or scheduled mode is outside its window |
| Grey | INACTIVE | Executable not found |
Click a process to open the Process Dialog for management and configuration.
reboot countdown & cancel
When a reboot or shutdown is scheduled (from the dashboard, from Cortex, or via the Tier 3 reboot_machine / shutdown_machine tools), the machine card displays a red pulsing MM:SS countdown timer in place of its normal status indicator. This gives the operator a visible, unambiguous window in which to abort.
timing
- Reboot and shutdown commands use a 30-second delay so running processes can flush state.
- The Cancel button on the machine card is the full-dashboard equivalent of the
cancel_reboottool. The agent runsshutdown /aand clears the reboot or shutdown flags. - Hovering the countdown swaps the
MM:SStext to cancel; clicking it sends the cancel command. - Cancel is available while more than 5 seconds remain in the countdown. The final 5 seconds are locked because Windows
shutdown /ais unreliable once the shutdown is already committing. - If the current user is not a site admin, no cancel handler is available, or the countdown has entered the final 5 seconds, the card shows a text-only
rebooting...orshutting down...pill instead of a clickable countdown. - Once the countdown expires the machine card flips to a rebooting or shutting-down state and the cancel path closes.
This behavior was introduced in v2.6.2 (commit 52e1ed8) and replaces the older fire-and-forget reboot UX.
machine information
Each machine reports additional details:
| field | description |
|---|---|
| Hostname | Windows computer name (used as machine ID) |
| OS | Windows version (e.g., "Windows 11 Pro 10.0.22631") |
| CPU model | Processor name (e.g., "Intel Core i9-9900X") |
| Agent version | Installed owlette version (e.g., "2.1.8") |
| Uptime | Time since last agent start |